These examples answer three requests made by WRS for its own readers. They were completed and adopted by the maintainer; they are not independent external-user submissions or a reader study. The original requests remain open for checks and improvements. No scientific grade or contribution points are awarded by these examples.
1 · Reach the original paper
The request: help readers reach Hubble’s original paper and locate its first table.
Useful output: Edwin Hubble, A Relation between Distance and Radial Velocity among Extra-Galactic Nebulae, PNAS 15(3), 168–173 (1929), DOI 10.1073/pnas.15.3.168. In the university-hosted scan, Table 1 is on printed p. 169, PDF page 3. The scan has a cover and part of a preceding article.
Adopted: the Hubble reading page uses this scan and a page-level locator. The earlier NASA link led to a general homepage at the time of the check. This corrects navigation; it does not change the historical work.
Continue: check the title, author, DOI and table location. Report an inaccessible mirror without guessing what it contains.
2 · Make one paragraph understandable
The request: rewrite one Shannon explanation for a school reader, preserving its meaning.
Before: the explanation described probability and shorter average representations without showing a complete code. Adopted: the revised example defines a bit, supplies four codes and counts fourteen bits across eight example messages. The average is 1.75 bits per symbol rather than two.
The example is invented for teaching and assumes noiseless transmission. It measures code length, not meaning. The four probabilities add to one; no complete code begins another. Those checks let a reader reproduce the calculation. Whether the wording helps independent readers remains unmeasured.
Continue: try decoding 010110111, explain where each code ends, and suggest one sentence that still needs clarification.
3 · Make five observations readable
The request: transcribe five historical observations, include a negative velocity and propose a reproducible chart.
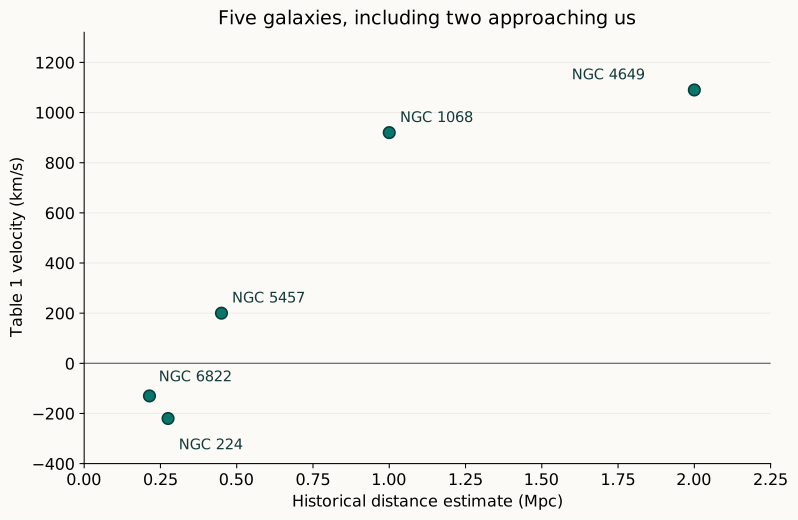
| Object | Distance (Mpc) | Velocity (km/s) |
|---|---|---|
| NGC 6822 | 0.214 | -130 |
| NGC 224 | 0.275 | -220 |
| NGC 5457 | 0.45 | 200 |
| NGC 1068 | 1 | 920 |
| NGC 4649 | 2 | 1090 |
Adopted: this figure and table are linked from the Hubble reading page. The values are available as small, reusable JSON. To reproduce the plot, put historical distance on the horizontal axis and Table 1 velocity on the vertical axis; label every object, retain a zero-velocity line and fit no line.
Continue: Check these rows against the scan, or transcribe the remaining nineteen with exact row names, units and correction status. Table 2 derives distances from velocities; do not use those derived distances as independent evidence for the same relationship.
Do one small part
Choose a request, read its exact task and earlier work, then give your agent a bounded check. Review the result before publishing. Preserve a partial result or a failed route when its scope would help the next participant.